
@ddd-ts-kit/sentry
The kernel ErrorReporter on Sentry or on GlitchTip, which speaks the same protocol: one adapter,
only the DSN differs. Unexpected failures only, each one leading to its trace, scrubbed before it
leaves the process. Nothing in domain/ or application/ imports this package, or reports
anything: handlers throw, and what stands around them reports.
npm i @ddd-ts-kit/sentry @sentry/node @opentelemetry/apiWritten against @sentry/node 11: the options it relies on (enableOpenTelemetrySetup,
dataCollection) do not exist in earlier majors.
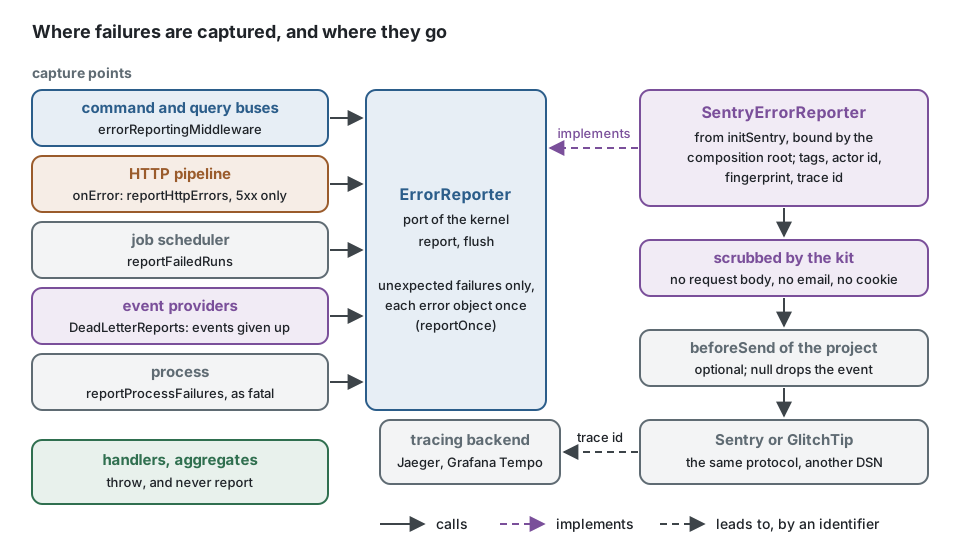
The code of a use case never sees the reporter. It throws; what stands around it decides whether
the failure is an incident, describes it with the identifiers of the work in progress and hands
it to the kernel ErrorReporter, the one port this package implements.
Composition root
Section titled “Composition root”// platform/errors.ts: imported second, right after platform/tracing.tsimport { reportProcessFailures } from '@ddd-ts-kit/kernel';import { initSentry } from '@ddd-ts-kit/sentry';import { loadConfig } from '@/platform/config/load-config';
// { dsn?, environment, release?, scrubMessages } of the validated configuration.// Without a DSN nothing starts and nothing is reported.export const errors = initSentry(loadConfig(process.env).errorReporting);
reportProcessFailures(errors); // uncaughtException and unhandledRejection: reported, then exit 1import { tracing } from '@/platform/tracing'; // firstimport { errors } from '@/platform/errors'; // secondimport { DeadLetterReports, ExecutionScope } from '@ddd-ts-kit/kernel';import { createApplication, kernelModule } from '@ddd-ts-kit/di';import { reportHttpErrors } from '@ddd-ts-kit/http';import { RabbitMqEventBus } from '@ddd-ts-kit/rabbitmq';
const deadLetters = new DeadLetterReports(errors);const bus = new RabbitMqEventBus({ url, onFailure: (failure) => deadLetters.onFailure(failure) });
const app = createApplication({ modules: [ kernelModule({ errorReporter: errors, // buses and jobs report through it, app.stop() flushes it eventBus: bus, eventSubscribers: { forContext: (name) => deadLetters.observing(bus.forConsumer(name)) }, }), ...contexts, ],});
const http = { onError: reportHttpErrors(errors), executionScope: app.resolve(ExecutionScope) };
process.on('SIGTERM', () => void app.stop().then(() => tracing.shutdown()));Three lines carry it: initSentry, errorReporter: errors, onError: reportHttpErrors(errors).
The process handlers and the dead letters are one line each, for who wants them.
init --errors sentry writes exactly these pieces, each in its file: platform/errors.ts as
above, with SENTRY_DSN, SENTRY_ENVIRONMENT (default: NODE_ENV), SENTRY_RELEASE and
SENTRY_SCRUB_MESSAGES read by platform/config/load-config.ts; errors handed by main.ts
to composeApplication, which gives it to kernelModule({ errorReporter });
reportHttpErrors in platform/auth/http-boundary.ts; DeadLetterReports in
platform/events/create-event-provider.ts (the broker) and in
platform/events/start-outbox-relay.ts (a publication declared dead).
Load order. platform/tracing.ts stays the first import: OpenTelemetry patches http and
the drivers when they are loaded, so it must run before them. initSentry patches nothing, so
its place changes nothing for tracing, whichever of the two starts first (both orders are
tested). It goes second so that a failure while the rest of the application loads is already
reported by reportProcessFailures.
What is reported
Section titled “What is reported”Only what nobody planned. A DomainError is a business refusal, an answer and not an incident.
| Capture point | Attached by | Reports | Does not report |
|---|---|---|---|
| command and query buses | kernelModule (the default buses carry errorReportingMiddleware) |
a command or a query that fails with anything but a DomainError |
a DomainError; anything while an event is consumed |
| HTTP | onError: reportHttpErrors(errors) |
every request answered 5xx, a DomainError mapped to a 5xx included |
a 4xx |
| scheduled jobs | kernelModule (the default scheduler observes with reportFailedRuns) |
a run whose outcome is failed, timeouts included |
a DomainError, a skipped or missed occurrence |
| integration events | DeadLetterReports on the onFailure hook of the provider |
an event given up: retries exhausted, poison message, publication of the outbox relay declared dead | a delivery that fails and is retried |
| process | reportProcessFailures(errors) |
uncaughtException and unhandledRejection, as fatal |
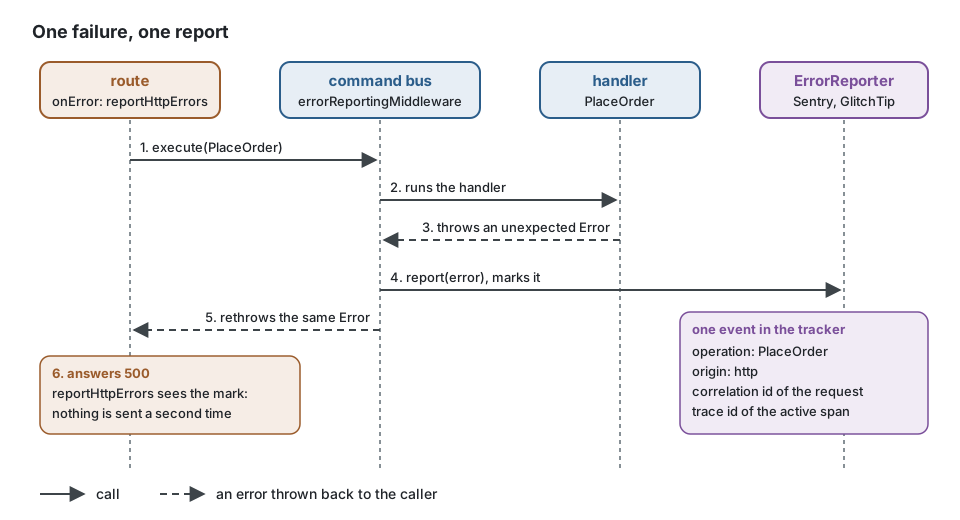
One failure, one report. The first capture point that sees an error object reports it and
marks it; the boundaries it crosses afterwards recognise it, also as the cause of an error
that wraps it. A command that fails inside a request is therefore reported once, by the bus,
under the name of the command, and the route that answers 500 stays silent. The report still
says where it came from: origin is the origin of the execution context (http, schedule),
and the correlation id and the trace lead to the request.
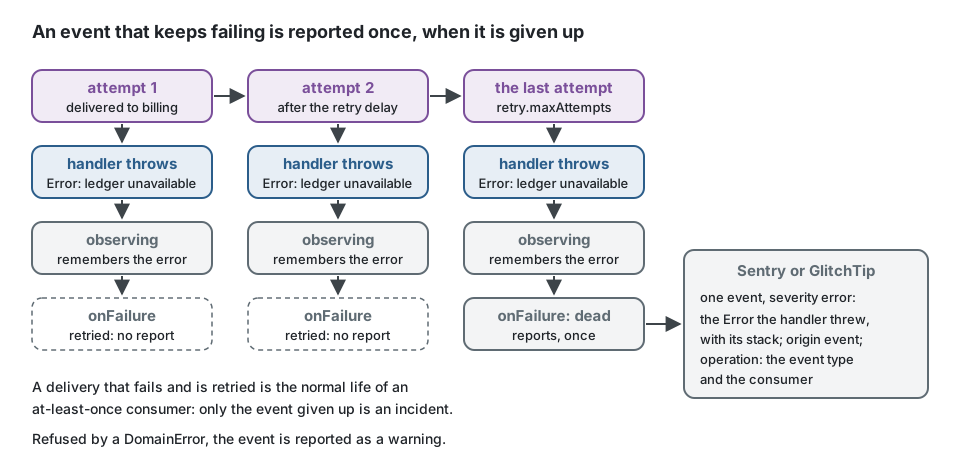
Events. A consumer is retried: its first failures are expected, and reporting them would
bury the real incidents. The bus middleware therefore says nothing while an event is consumed,
and DeadLetterReports reports the event once its provider gives it up. The hooks of the
providers say codes only, so observing(subscriber) remembers what each handler threw: the
report carries the real error and its stack. Without it, or for a poison message, the report
is a DeadLetterError naming the code. An event buried by a DomainError is reported as a
warning: it is lost to its consumer all the same.
The same steps, played by hand against the doubles of the kernel, as a test of the wiring would:
import {  DeadLetterReports,  InMemoryErrorReporter,  type IntegrationEvent,  type IntegrationEventCallback,  type IntegrationEventSubscriber,} from '@ddd-ts-kit/kernel';
// A provider reduced to what matters here: it keeps the handler it is given.const handlers = new Map<string, IntegrationEventCallback>();const provider: IntegrationEventSubscriber = {  subscribe: (type, handler) => {    handlers.set(type, handler);
    return { unsubscribe: () => handlers.delete(type) };  },};
const reporter = new InMemoryErrorReporter();const deadLetters = new DeadLetterReports(reporter);
deadLetters.observing(provider).subscribe('ordering.order.placed', async () => {  throw new Error('ledger unavailable');});
const event: IntegrationEvent = {  id: 'evt-1',  type: 'ordering.order.placed',  version: 1,  occurredAt: '2026-03-01T10:00:00.000Z',  payload: {},};const deliver = handlers.get('ordering.order.placed');
// What the provider says of each failed delivery: codes and identifiers only.const failure = { kind: 'handler', code: 'Error', eventId: 'evt-1', eventType: 'ordering.order.placed', consumer: 'billing' };
await deliver?.(event).catch(() => undefined); // attempt 1 fails: observing remembers the errordeadLetters.onFailure({ ...failure, attempt: 1 }); // retried: no report
await deliver?.(event).catch(() => undefined); // attempt 2, the last one, failsdeadLetters.onFailure({ ...failure, attempt: 2, dead: true }); // given up: one report
// One report: the Error('ledger unavailable') itself, origin 'event', operation 'ordering.order.placed billing'.export const reports = reporter.reports;
In a handler. Nothing to write: a handler throws, and the capture point around it reports.
import { ConceptError, type ErrorReporter } from '@ddd-ts-kit/kernel';
interface PaymentGateway {  capture(paymentId: string): Promise<'captured' | 'declined'>;}
interface CapturePaymentCommand {  readonly paymentId: string;}
export class PaymentError extends ConceptError {  static declined(paymentId: string) {    return PaymentError.refusal('PAYMENT_DECLINED', `Payment ${paymentId} was declined.`, { paymentId });  }}
// Instead of: a handler that reports by itself, and hides the failure from its caller.export class CapturePaymentReportingItself {  constructor(    private readonly gateway: PaymentGateway,    private readonly errors: ErrorReporter,  ) {}
  async execute(command: CapturePaymentCommand): Promise<void> {    try {      await this.gateway.capture(command.paymentId);    } catch (error) {      this.errors.report(error, { origin: 'command', operation: 'CapturePayment', severity: 'error' });    }  }}
// Write: a handler that throws. A refusal is a DomainError, answered and never reported;// anything else goes up to the bus, which reports it once, with the actor, the tenant and the trace.export class CapturePaymentHandler {  constructor(private readonly gateway: PaymentGateway) {}
  async execute(command: CapturePaymentCommand): Promise<void> {    if ((await this.gateway.capture(command.paymentId)) === 'declined') {      throw PaymentError.declined(command.paymentId);    }  }}
With OpenTelemetry
Section titled “With OpenTelemetry”@ddd-ts-kit/tracing owns the tracer provider, the context manager, the propagator and the
auto-instrumentations. initSentry leaves all of them alone:
enableOpenTelemetrySetup: false: the SDK registers no tracer provider and no propagator;- none of the SDK's default integrations, and
enableRuntimeChannelInjection: false: no second instrumentation ofhttpor of a driver; - no
tracesSampleRateunless given: no performance data goes to the tracker.
What links the two is one read: when a failure is reported, the reporter takes the trace id and
the span id of the active OpenTelemetry span and puts them in contexts.trace of the event.
From an issue in Sentry or GlitchTip, the trace id opens the trace in the tracing backend. The
spans themselves are exported once, by the exporter of the kit.
Privacy
Section titled “Privacy”| Default | Opt in | |
|---|---|---|
| request | never collected. If something else adds one: method, URL without query string, headers that carry neither a credential nor an address. No body, no cookie | a project beforeSend |
| user | the actor id, nothing else: no email, no name, no address | |
| tenant | not sent | tagTenant: true |
| local variables | never | |
| breadcrumbs | none is recorded automatically: no console, no outgoing call | Sentry.addBreadcrumb where the project decides |
| exception message | sent | scrubMessages: true removes it for every error that is not a DomainError |
Messages. The message is the first thing read in an error tracker, and the first place
where personal data leaks: a driver quotes the row it refused. The default keeps it, because an
issue titled [message removed] costs every investigation, and because the tracker is an
internal tool whose access and retention the project controls. With scrubMessages: true only
the messages the project wrote itself survive, those of its DomainErrors; type, code, stack
and trace remain for the others. Turn it on when the tracker is hosted by a third party or
when the data is sensitive enough that no operator should read it there. The loggers of the
kit (StdoutLogger, @ddd-ts-kit/pino, @ddd-ts-kit/winston) take the option under the same
name, with the same rule and the same marker, SCRUBBED_MESSAGE of the kernel.
beforeSend runs last, on the scrubbed event, and may drop it by answering null.
The DSN stays inside the SDK client. A SentryErrorReporter that is logged, spread or
serialised shows SentryErrorReporter [client concealed]; the client of the SDK, if you log
it yourself, shows its options.
Grouping and tags
Section titled “Grouping and tags”The fingerprint never contains the message, so identifiers in a message do not turn one problem
into thousands of issues: a DomainError is its class and its code; any other error is its
class, its code when it has one, and the function and file of its first frame, without line
numbers.
Tags: origin, operation, correlation_id, bounded_context, error_code, and tenant_id
on request. The fields a project adds to ErrorReportExtensions are sent as the report
context.
Options
Section titled “Options”| Option | Default | |
|---|---|---|
dsn |
none | without it initSentry answers a NoopErrorReporter and starts nothing. SENTRY_DSN is not read behind the configuration |
environment, release |
none | |
enabled |
true |
false reports nothing, whatever the DSN |
sampleRate |
1 | share of the error events sent |
tracesSampleRate |
none | only for spans started through the Sentry API; the spans of the kit never go there |
scrubMessages |
false |
see "Privacy" |
tagTenant |
false |
|
beforeSend |
none | runs after the scrubber of the kit |
integrations |
none | added to linked errors and source context lines |
flush(timeoutMs) answers true when nothing is left to send. app.stop() calls it with two
seconds; reportProcessFailures does before exiting.
GlitchTip for development
Section titled “GlitchTip for development”GlitchTip 6 runs as one service next to its PostgreSQL (14 or later) and, recommended by its documentation, Valkey. The development image bootstraps a user, an organization and a project and prints the DSN:
services:  glitchtip:    image: glitchtip/glitchtip:6.2.6    profiles: [errors]    depends_on:      glitchtip-postgres: { condition: service_healthy }      glitchtip-valkey: { condition: service_started }    ports: ['127.0.0.1:8000:8000']    environment:      SERVER_ROLE: all_in_one # web and worker in one process      DATABASE_URL: postgres://postgres:postgres@glitchtip-postgres:5432/glitchtip      VALKEY_URL: redis://glitchtip-valkey:6379      SECRET_KEY: local-development-only-not-a-secret # never in production: openssl rand -hex 32      GLITCHTIP_DOMAIN: http://localhost:8000      EMAIL_URL: consolemail://      DEFAULT_FROM_EMAIL: glitchtip@localhost      DEBUG: 'true' # development only: required by the bootstrap below      GLITCHTIP_BOOTSTRAP_DEV: 'true' # user test@example.com / admin_pass, organization, project, DSN    healthcheck:      test: [CMD, python, healthcheck.py]      interval: 10s      timeout: 6s      retries: 6      start_period: 180s # the first start migrates the database  glitchtip-postgres:    image: postgres:18-alpine    profiles: [errors]    environment: { POSTGRES_DB: glitchtip, POSTGRES_PASSWORD: postgres }    volumes: ['glitchtip-postgres:/var/lib/postgresql']    healthcheck:      test: [CMD-SHELL, pg_isready -U postgres -d glitchtip]      interval: 5s      retries: 12  glitchtip-valkey:    image: valkey/valkey:9-alpine    profiles: [errors]
volumes:  glitchtip-postgres:
docker compose --profile errors up -d --waitdocker compose logs glitchtip | grep 'DSN:'Put the DSN in SENTRY_DSN; from another container of the stack, replace localhost with
glitchtip. Sign in at http://localhost:8000 with the user above.
In a test
Section titled “In a test”Nothing of this package: the test application binds InMemoryErrorReporter, and
app.errors.reports lists what the buses and the jobs reported, as data: each entry is
{ error, report }, the error as it was thrown and the ErrorReport that describes it.