
Observability: tracing backends, loggers and error tracking
Summary. Three decisions hide under one word. Where traces go (the kit emits OpenTelemetry
traces over OTLP; Jaeger and Grafana Tempo are two backends that receive them), which library
writes logs (a dependency-free JSON logger, pino or winston, all behind the kernel Logger
port), and where unexpected failures are collected (Sentry or GlitchTip, behind the
ErrorReporter port). The kit wires traces, logs and error reports and ties them by one
correlation id. It ships no metrics exporter: the Metrics port is bound to a no-op in a
generated project until you write the adapter.
What the kit emits, and what you choose
Section titled “What the kit emits, and what you choose”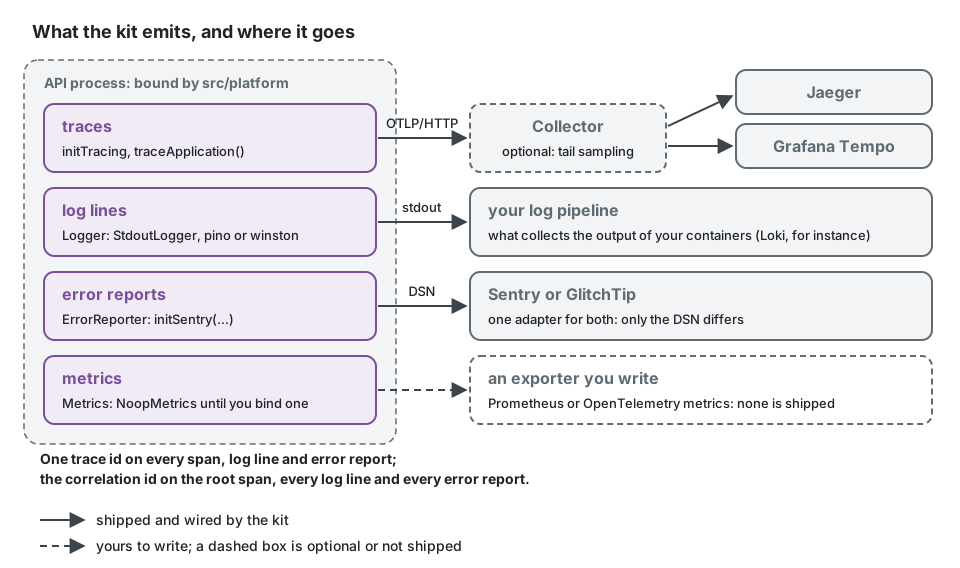
Read the drawing from left to right. Each box on the left is an adapter the platform binds once,
in src/platform/; no file of a bounded context knows any of them. Each box on the right is a
tool you choose and run, and the rest of this page compares them. The only arrow you have to
draw yourself is the last one: the kit measures durations and outcomes through the Metrics
port, and sends them nowhere until a project binds an exporter.
The concepts (what a span may carry, how the correlation id links a trace, its log lines, its audit entries and its error report) are on the observability concept page. This page is about the tools on the receiving side.
Third-party facts below were checked on 2026-10-10 against the sources listed at the end.
Tracing: OpenTelemetry, Jaeger, Grafana Tempo
Section titled “Tracing: OpenTelemetry, Jaeger, Grafana Tempo”OpenTelemetry is the instrumentation standard and the wire protocol (OTLP), not a backend. Choosing it is what keeps the backend replaceable.
| Jaeger | Grafana Tempo | |
|---|---|---|
| What it is | a tracing backend with its own search UI | a tracing backend designed around object storage, read through Grafana |
| Version seen | v2.22.0 (2026-10-06) | v3.1.0 (2026-09-29) |
| Licence | Apache-2.0 | AGPL-3.0 |
| Governance | CNCF graduated | Grafana Labs |
| Ingestion | OTLP natively since v2, which is built on the OpenTelemetry Collector | OTLP, among other protocols |
| Storage | memory for development; a database for production (the supported list was not re-checked for this page) | object storage (S3-compatible, GCS, Azure) or a local disk |
| Query | by service, operation, tags, duration, trace id | TraceQL, plus trace id lookup |
| Fits | one container on a laptop; a team that wants a tracing UI and nothing else | a team already running Grafana, wanting traces next to logs and metrics, with long retention at low storage cost |
| Costs | production storage is a database to run | more moving parts in production; the UI is Grafana |
Selection criteria:
- What you already run. With Grafana, Loki and Prometheus in place, Tempo completes the set and lets a dashboard pivot from a log line to its trace. Without them, Jaeger is one service.
- Retention and volume. Object storage is cheap for weeks of traces; an indexed database searches faster and costs more to keep.
- Licence. AGPL-3.0 matters to some organisations even for a service they only run; check your policy.
- Sampling. Keeping every trace that ends in error cannot be decided when a trace starts. It is tail sampling, done by an OpenTelemetry Collector between the application and either backend. The tracing README gives a collector configuration for it.
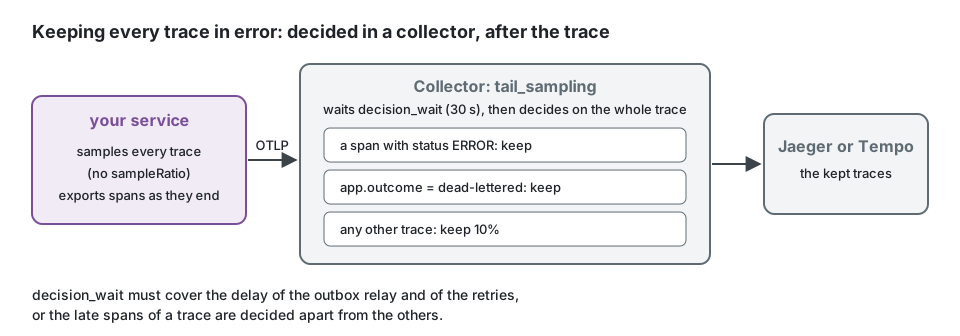
The application then samples everything (no sampleRatio), and the policies live in the
collector, next to the backend they feed. Without a collector, initTracing({ sampleRatio: 0.2 })
keeps a fifth of the traces, decided where each trace starts: a trace in error is dropped as
often as any other.
A hosted backend that accepts OTLP is a third option; none was evaluated here.
Loggers: StdoutLogger, pino, winston
Section titled “Loggers: StdoutLogger, pino, winston”StdoutLogger (aspects package) |
pino (@ddd-ts-kit/pino) |
winston (@ddd-ts-kit/winston) |
|
|---|---|---|---|
| Dependency | none | pino (10.4.0 on npm, MIT) | winston (3.19.0 on npm, MIT) |
| Output | JSON lines on the standard output | JSON lines, optional pretty format in development, pino transports | JSON lines, winston formats and transports |
| Cost of a line, as measured in the kit's READMEs | not stated | about 3 microseconds | about 7 microseconds, more with each format |
| Buffering | none | none by default; an asynchronous mode buffers 4 KiB and can lose the last lines of a killed process | none in the adapter |
| Redaction of credentials | none (the aspects README says so); scrubMessages removes the message of errors that are not a DomainError |
compiled by pino | a pass over top-level values |
| Chosen by | init --logger stdout (the default) |
init --logger pino |
init --logger winston |
| Take it when | JSON on stdout is all you need | volume matters, the framework already speaks pino (Fastify), or you want its transports | the team already runs winston transports and formats (rotating files, syslog, a vendor transport) |
The measurements are those the two READMEs report (Node 24, a child logger, four correlation fields, three fields, a sink that discards). They compare the two adapters with each other, on one machine, and are not a benchmark of the libraries.
Selection criteria: volume first (winston's cost is "nothing at a few hundred lines per second
and visible at tens of thousands", in the README's words), then what the team already
operates. The three implement one port and pass one contract suite (loggerContract), so the
choice is one line of the composition root and can be revisited:
import { StdoutLogger } from '@ddd-ts-kit/aspects';import { AsyncLocalStorageExecutionScope, type Logger } from '@ddd-ts-kit/kernel';import { createPinoLogger } from '@ddd-ts-kit/pino';import { traceLogFields } from '@ddd-ts-kit/tracing';import { createWinstonLogger } from '@ddd-ts-kit/winston';
declare const choice: 'stdout' | 'pino' | 'winston';
const executionScope = new AsyncLocalStorageExecutionScope();
// Read at each line: correlation id, origin, actor and tenant of the work in progress,// then trace_id and span_id of the active span. The same fields whatever the library.const fields = () => traceLogFields(executionScope);
// Three adapters of one port, held to one contract suite: changing library is this line.export const logger: Logger = {  stdout: () => new StdoutLogger({ fields, base: { service: 'scheduling' } }),  pino: () => createPinoLogger({ service: 'scheduling', fields }),  winston: () => createWinstonLogger({ service: 'scheduling', fields }),}[choice]();
A generated project writes one of the three in src/platform/observability/create-logger.ts,
after the --logger flag of init; the example application uses pino.
Error tracking: Sentry, GlitchTip
Section titled “Error tracking: Sentry, GlitchTip”| Sentry | GlitchTip | |
|---|---|---|
| What it is | error and performance monitoring, hosted or self-hosted | an error tracker that speaks the Sentry protocol |
| Licence | the server is under the Functional Source License (FSL-1.1-Apache-2.0), which is not an open-source licence; the SDKs are MIT | MIT |
| Version seen | server 26.9.0 (2026-09-15); @sentry/node 11.6.0 |
v6.2.6 (tag of 2026-08-07) |
| Self-hosting | Docker Compose with an install script, single-node services including Kafka; the documentation asks for at least 4 CPU cores and 16 GB of memory plus 16 GB of swap | one service next to PostgreSQL 14 or later; Valkey (or Redis) 7 or later is optional, advised "for faster or larger instances" |
| Scope, as each documentation lists it | issues, traces and spans, logs, session replay, profiling, application metrics, user feedback, dashboards, releases, monitors and alerts (cron and uptime monitors) | error tracking, performance monitoring, uptime monitoring, logs |
| Fits | a team that wants the hosted service or the full feature set | a small team that wants errors collected on its own infrastructure with little to operate |
The self-hosting and scope rows were read on 2026-10-10 from the Sentry self-hosted documentation (https://develop.sentry.dev/self-hosted/), the Sentry product index (https://docs.sentry.io/product/), the GlitchTip documentation index (https://glitchtip.com/documentation) and its installation guide (https://glitchtip.com/documentation/install). They list what each project documents, not what was tried here. The GlitchTip pages read do not mention session replay or profiling.
The kit's adapter is the same for both: only the DSN differs.
import { reportProcessFailures } from '@ddd-ts-kit/kernel';import { initSentry } from '@ddd-ts-kit/sentry';
// What the validated configuration read from SENTRY_DSN, SENTRY_ENVIRONMENT and SENTRY_RELEASE.declare const config: { readonly dsn: string; readonly environment: string; readonly release: string };
// The DSN of a Sentry project or of a GlitchTip project: the same call, the same reports.// An empty DSN starts no SDK, and the reporter it answers reports nothing.export const errors = initSentry({ dsn: config.dsn, environment: config.environment, release: config.release });
// uncaughtException and unhandledRejection: reported as fatal, then exit code 1.reportProcessFailures(errors);
Not verified: which of the fields and envelope types the Sentry SDK sends GlitchTip accepts or ignores. The GlitchTip pages read do not say, and nothing beyond the adapter's own suite was run against a GlitchTip server for this page.
What this kit supports and verified
Section titled “What this kit supports and verified”Tracing (@ddd-ts-kit/tracing):
- an OpenTelemetry bootstrap for Node that exports traces over OTLP/HTTP to the endpoint named
by the standard
OTEL_EXPORTER_OTLP_ENDPOINTvariable; without it nothing is exported; - spans put around the application from outside, once, by the platform
(
kernelModule({ instrumentation: traceApplication() }),tracedPublisher(bus)for the relay): one per use case, repository or adapter call, domain event, publication, consumer and job, so that no file of a context imports a tracing library (tracing/platform-onlyin the architecture reference); traceparentcarried in the event envelope and stored with the outbox record, so a trace continues across the relay and the consuming context, and a sampling decision holds for the whole trace;- an attribute allow-list, scrubbing of URL secrets and of exception messages, caps on the number of dependency spans under one root;
- a compose example for Jaeger v2 (image
jaegertracing/jaeger:2.22.0); a generated project has Jaeger behind theobservabilityprofile of its compose file; - a collector configuration for tail sampling, as an example.
Tempo is not named in the package README. It receives OTLP, so the same exporter should reach it; this was not run in this repository.
What tracing/platform-only refuses, and what to write instead. Instead of opening spans in a
handler:
// contexts/scheduling/application/book-appointment.handler.ts: refusedimport { trace } from '@opentelemetry/api';
const span = trace.getTracer('scheduling').startSpan('book appointment');span.setAttribute('client.email', command.clientEmail); // personal data on a span
write nothing in the handler, and wrap the application once, from the platform. The command
then gets its span, command BookAppointment, with its context and its outcome, and its
repositories, events and publications get theirs below it:
import { kernelModule } from '@ddd-ts-kit/di';import { traceApplication } from '@ddd-ts-kit/tracing';
// src/platform/: one value, and every use case, adapter, event, consumer and job is traced.export const kernel = kernelModule({ instrumentation: traceApplication() });
If debugging needs the value, that is a log line with an identifier, written by an adapter, with the retention of your logs.
Logs: StdoutLogger is what a generated project binds by default, with the trace ids and
the correlation fields of the execution scope on every line. init --logger pino and
init --logger winston generate src/platform/observability/create-logger.ts on
@ddd-ts-kit/pino (written against pino 10) or @ddd-ts-kit/winston (written against
winston 3.19) instead, with the same fields. For NestJS, each README shows a bridge of a few
lines for the framework's own messages and ships none.
Error reports (@ddd-ts-kit/sentry): written against
@sentry/node 11, with five capture points attached from outside (buses, HTTP 5xx, jobs,
dead-lettered events, process failures), one report per failure, a DomainError never
reported as an incident. The Sentry SDK is initialised so that it registers no tracer provider
and no second instrumentation: the tracing package owns OpenTelemetry, and the report carries
the trace id of the active span. init --errors sentry generates the wiring
(src/platform/errors.ts, configured by SENTRY_DSN) and a compose service running
GlitchTip 6.2.6 behind the errors profile, for development.
Metrics: the kernel defines the Metrics port (counters, histograms, gauges, with label
values from a small closed set) and the aspects package records durations and outcomes through
it. A generated project binds a NoopMetrics behind a TODO(platform). A search of the
repository finds no Prometheus or OpenTelemetry metrics exporter, and the tracing bootstrap
turns off runtime and host metrics.
What is measured, once an adapter is bound: use_case_duration_ms and use_case_total from
metricsMiddleware on the buses (labels message, kind and outcome, plus error_code on
the counter), dependency_call_duration_ms and dependency_call_total from the timed aspect
on the adapters it wraps (the prefix is its name option), and cache_errors_total from
RedisCache. An adapter of the port is three methods. This one sits on
the OpenTelemetry metrics API; it compiles against the packages of the workspace, and was not
run against a backend for this page:
import { Metrics, type Counter, type Gauge, type Histogram } from '@ddd-ts-kit/kernel';import type { Meter } from '@opentelemetry/api';import { PrometheusExporter } from '@opentelemetry/exporter-prometheus';import { MeterProvider } from '@opentelemetry/sdk-metrics';
/** The Metrics port on OpenTelemetry instruments. Asking twice for a name answers the same series. */export class OpenTelemetryMetrics implements Metrics {  private readonly counters = new Map<string, Counter>();  private readonly histograms = new Map<string, Histogram>();  private readonly gauges = new Map<string, Gauge>();
  constructor(private readonly meter: Meter) {}
  counter(name: string): Counter {    return once(this.counters, name, () => {      const instrument = this.meter.createCounter(name);
      return { increment: (labels, by = 1) => instrument.add(by, labels) };    });  }
  histogram(name: string): Histogram {    return once(this.histograms, name, () => {      const instrument = this.meter.createHistogram(name);
      return { record: (value, labels) => instrument.record(value, labels) };    });  }
  gauge(name: string): Gauge {    return once(this.gauges, name, () => {      const instrument = this.meter.createGauge(name);
      return { set: (value, labels) => instrument.record(value, labels) };    });  }}
function once<T>(made: Map<string, T>, name: string, make: () => T): T {  const existing = made.get(name) ?? make();
  made.set(name, existing);
  return existing;}
// src/platform/observability/create-metrics.ts: /metrics on port 9464, for Prometheus to scrape.const provider = new MeterProvider({ readers: [new PrometheusExporter({ port: 9464 })] });
export const metrics: Metrics = new OpenTelemetryMetrics(provider.getMeter('scheduling'));
Label values come from a small closed set (MetricLabels of the kernel): never an identifier,
never user input, so the number of series stays bounded.
The four, wired in the platform
Section titled “The four, wired in the platform”The sample condenses what the example application spreads over
src/platform/lay-foundations.ts (the pino logger and the metrics), src/platform/platform.module.ts
(the bindings) and src/platform/errors.ts (Sentry). A generated project has these files on the
tsyringe family, errors.ts only with --errors sentry. The tracing bootstrap
(initTracing of @ddd-ts-kit/tracing/node) is not in it: it lives in its own module,
src/platform/tracing.ts, imported first by main.ts, because the instrumentations patch
http and the drivers when they are loaded.
import { StdoutLogger } from '@ddd-ts-kit/aspects';import { kernelModule } from '@ddd-ts-kit/di';import { AsyncLocalStorageExecutionScope, NoopMetrics } from '@ddd-ts-kit/kernel';import { initSentry } from '@ddd-ts-kit/sentry';import { traceApplication, traceLogFields } from '@ddd-ts-kit/tracing';
declare const sentryDsn: string;
const executionScope = new AsyncLocalStorageExecutionScope();
export const kernel = kernelModule({  // One scope for the buses, the logger and the spans: the correlation id is the same in all three.  executionScope,  logger: new StdoutLogger({ fields: () => traceLogFields(executionScope) }),  // TODO(platform): an adapter of the port, such as the one above.  metrics: new NoopMetrics(),  // Buses and jobs report through it; app.stop() flushes it.  errorReporter: initSentry({ dsn: sentryDsn }),  // Spans around every use case, adapter, event, consumer and job.  instrumentation: traceApplication(),});
Three places stay outside of the kernel module and take one wrapper each, as the
tracing README shows: the HTTP pipeline
(around: tracedRoutes(), with onError: reportHttpErrors(errors) for the 5xx answers), the
publisher of the outbox relay (tracedPublisher(bus)), and the dead letters of a broker
(DeadLetterReports).
Following one action across the four
Section titled “Following one action across the four”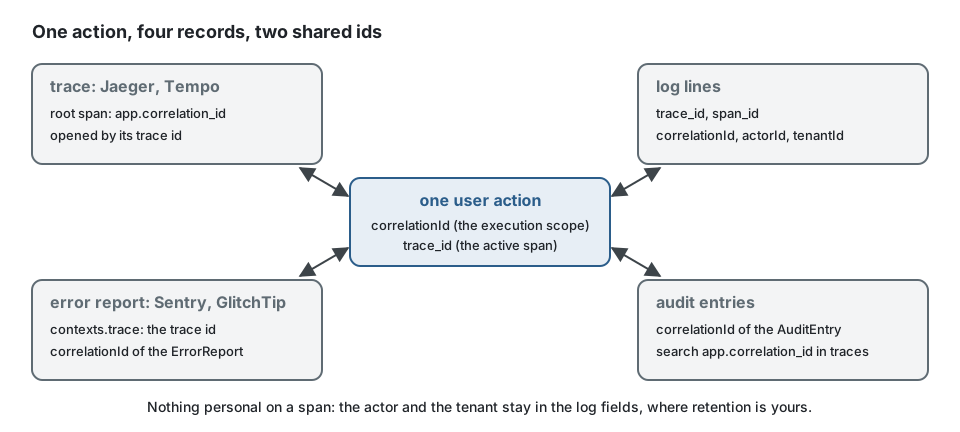
The tools are separate; the ids are not. An error report in GlitchTip carries the trace id of
the span that was active when it failed (contexts.trace): paste it in Jaeger and the whole
request opens, the consumers of its events included. Search the log pipeline for that
trace_id, or for its correlationId, and the log lines of every bounded context the action
reached come back. The audit entries of the action share its correlationId. This is why the
choice of each tool is independent of the others: what ties them is written by the kit, not by
the tools.
Limits and when not to use it
Section titled “Limits and when not to use it”- Traces only through OpenTelemetry. No metrics export and no log export over OTLP are
provided. Logs leave on the standard output for your log pipeline; metrics need an adapter of
the
Metricsport that you write. - Logging bridges of the auto-instrumentations are off by default: log lines carry trace ids because the logger reads them, not because OpenTelemetry injects them.
- Spans carry names and codes, never data. A business value wanted on a trace is refused by design. If debugging needs payloads, that is a log decision with its own retention, not a span attribute.
- Per-root span caps (25 per name, 200 in total by default) mean a loop over a thousand repository calls is not fully traced; a counter on the root span says how many were dropped.
- Head sampling in the application is a ratio. Error-biased sampling needs a collector.
- Asynchronous pino can lose its last lines when the process is killed without a handler.
- No Nest logger bridge is shipped.
- Not verified in this repository: Tempo as a backend, Sentry's hosted service at volume, GlitchTip's handling of every field the adapter sends. The comparison rows of Sentry and GlitchTip above repeat each project's documentation.
- When not to add a tracing backend at all: a single process with few dependencies is often served by correlation ids in structured logs. Start the SDK later; the code does not change, since nothing in the inner layers knows about tracing.
Recommendation by situation
Section titled “Recommendation by situation”| Situation | Choice |
|---|---|
| Local development, first weeks | Jaeger from the generated compose profile, StdoutLogger, no error tracker |
| Small team, self-hosted, little to operate | Jaeger, StdoutLogger or pino, GlitchTip |
| Grafana stack already in place | Tempo behind a collector, pino or StdoutLogger to Loki, metrics through an adapter you write |
| High log volume, or Fastify | pino, synchronous unless a profile says otherwise |
| Existing winston transports to keep | winston |
| Full product analytics on errors, hosted | Sentry |
| Several contexts extracted as services | the same setup in each; a collector with tail sampling becomes worth its cost |
Sources
Section titled “Sources”- This repository:
packages/tracing/README.md,packages/pino/README.md,packages/winston/README.md,packages/sentry/README.md,packages/aspects/README.md,packages/kernel/README.md(Logger, Metrics, ErrorReporter),packages/cli/README.md. - OpenTelemetry documentation: https://opentelemetry.io/docs/ ; OTLP specification: https://opentelemetry.io/docs/specs/otlp/ ; W3C Trace Context: https://www.w3.org/TR/trace-context/
- Jaeger: https://www.jaegertracing.io/docs/ and https://github.com/jaegertracing/jaeger/releases
- Grafana Tempo: https://grafana.com/docs/tempo/latest/ and https://github.com/grafana/tempo/releases (licence file: AGPL-3.0).
- OpenTelemetry Collector tail sampling processor: https://github.com/open-telemetry/opentelemetry-collector-contrib/tree/main/processor/tailsamplingprocessor
- pino: https://getpino.io ; winston: https://github.com/winstonjs/winston
- Sentry licence: https://github.com/getsentry/sentry/blob/master/LICENSE.md ; Node SDK: https://docs.sentry.io/platforms/javascript/guides/node/
- GlitchTip: https://glitchtip.com/documentation , https://glitchtip.com/documentation/install (read on 2026-10-10) and https://gitlab.com/glitchtip/glitchtip-backend (licence MIT, tags).
- Sentry self-hosted: https://develop.sentry.dev/self-hosted/ ; product index: https://docs.sentry.io/product/ (read on 2026-10-10).
- CNCF maturity levels read from the CNCF landscape data (https://github.com/cncf/landscape).
See also
Section titled “See also”- Observability (concept)
- The actor and the execution scope: where the correlation id comes from
- Audit trail
- Resilience
- HTTP frameworks
- Message brokers